The numbers don't lie
Watching the Count Fall
Average sperm concentration, Western men — 1973
↓ Scroll to begin
The Evidence at a Glance
Data drawn from meta-analyses of hundreds of studies spanning five decades of research across six continents.
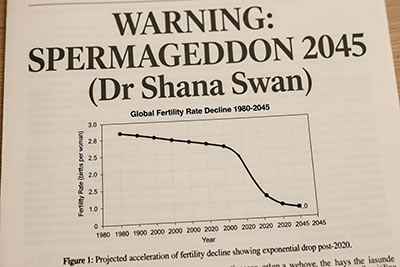
"If you extend the line, it reaches zero in 2045."
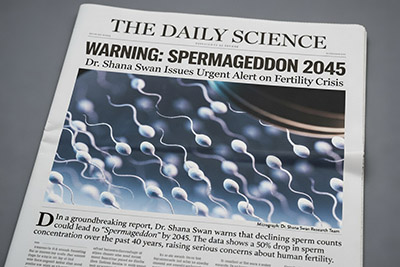
In 2017, epidemiologist Dr. Shanna Swan and her colleagues published the largest meta-analysis of sperm counts ever conducted. The finding — a 52.4% decline in Western men since 1973, with no sign of levelling off — made headlines worldwide. Her linear projection to zero by 2045 became the defining image of the crisis.
But Swan herself cautioned that this was a simple extrapolation from existing data. What she could not have known was that the picture was about to get much worse.
The Decline Is Accelerating
When Levine et al. updated the analysis in 2023 with global data through 2018, they discovered something alarming.
1973 – 2000
−1.16%
per year
Post 2000
−2.64%
per year — more than double
The rate of decline more than doubled after the turn of the millennium. Swan's 2045 projection was based on the slower, pre-2000 rate. She was drawing her line with old data — and the real trajectory is steeper than she knew.
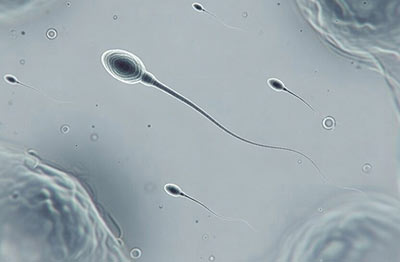
Layer 1 — Observed Data
The Measured Decline
Sperm concentration in Western men fell from 99 M/mL in 1973 to 47.1 M/mL by 2011, confirmed across 185 studies and 42,935 men. Updated global data through 2018 shows ~49 M/mL.
Levine et al., Human Reproduction Update, 2017 & 2023
Layer 2 — Swan's 2045 Projection
The Line That Made Headlines
Extending the 1973–2011 linear trend (~1.4% per year) forward, Swan projected the median sperm count would reach zero by approximately 2045. At that point, half of all men would have no viable sperm.
Swan, Count Down (2021); Levine et al. 2017
Layer 3 — The Accelerated Reality
But the Decline Has Doubled
Post-2000 data shows the decline rate jumped to 2.64% per year. Applying this steeper trajectory from the year 2000 onward brings the zero crossing significantly earlier — and the WHO subfertility threshold even sooner.
Levine et al., 2023 (post-2000 sub-analysis)
Layer 4 — Compounding Factors

What the Models Don't Include
Neither projection accounts for the stress–infertility feedback loop, accelerating microplastic accumulation, rising PFAS exposure, or falling testosterone. Each of these is independently worsening — and they compound each other. The true trajectory likely falls within this uncertainty band.
Layer 5 — The Critical Thresholds
Median Zero vs. Total Collapse
Median zero is when average concentration crosses the WHO's 15 M/mL threshold — at that point, more than half of men are clinically subfertile. Natural conception becomes a coin flip at best.
Total zero is when the trend line reaches 0 M/mL — unassisted reproduction becomes statistically impossible. The gap between these dates is the collapse window.
What "Median Zero" Actually Means
When Swan says sperm counts could reach "zero by 2045," she is describing the median — the statistical midpoint. At that moment, half of all men would produce no viable sperm at all. The other half would have counts so low that natural conception would be extremely unlikely without medical intervention.
But the crisis begins long before zero. When average concentration crosses the WHO's 15 M/mL threshold, the majority of the male population would be classified as subfertile. At current acceleration, that threshold could be breached within the next two decades. This is not a future problem. It is a present trajectory.
Understand the causes →Why Every Projection Is an Underestimate
The published decline rates are based purely on observed sperm count data. They do not model the compounding biological and environmental pressures that are independently accelerating.
Feedback Loop
The Stress Spiral
As infertility rises, so does psychological stress — which further suppresses testosterone, impairs spermatogenesis, and damages sperm DNA via oxidative stress. The more men struggle with fertility, the worse their fertility becomes. This self-reinforcing cycle is not modelled in any current projection.
Accumulation
Microplastic Burden
Microplastics were found in 100% of human testicular samples tested in 2024. Global plastic production continues to rise exponentially, meaning each generation carries a higher toxic burden than the last. The reproductive impact is non-reversible, cumulative and intergenerational.
Hormonal Collapse
Falling Testosterone
A 25% decline in average testosterone among young men in under two decades. Testosterone is the master hormone of spermatogenesis — its decline mirrors and amplifies the sperm count crisis. The two trends are not independent; they are the same crisis measured two ways.
Chemical Saturation
Forever Chemical Exposure
PFAS contamination is now detectable in 98% of Americans. These chemicals do not break down, accumulate in reproductive tissue, and directly suppress testosterone and sperm production further compounding the problem. Every year, the baseline exposure level rises.
The Window Is Closing
Swan compared the fertility crisis to climate change — and warned we are 40 years behind in awareness. The data has been clear for a decade. The acceleration has been confirmed. The compounding factors are documented. What remains is whether we act on what we already know.